Disability - by Gender
This report provides a breakdown of students with disabilities in Indiana public schools, disaggregated by gender. It is based on data submitted to the Indiana Department of Education (IDOE) and reflects counts of students identified as having one or more disabilities under federal and state special education guidelines. The purpose of this report is to offer insights into the distribution of disabilities among male and female students to support data-informed decision-making, promote equitable access to services, and meet federal and state reporting requirements.
Submission requirements
This is a pre-configured report and has no submission criteria as a prerequisite.
Generate report
From the Reporting menu, choose Standard report.
Click IDOE Public Students Report, then click Disability - By Gender Report.
Use the drop-down list for the field Organizational Location Filter to select the name of an institution.
Click Update Report with Values.
Report Field description and criteria
Primary Disability Name | Male | Female | Total |
Autism Spectrum Disorder | |||
Blind or Low Vision | |||
Deaf or Hard of Hearing | |||
Deaf-Blind | |||
Developmental Delay (Ages 3-8 only) | |||
Emotional Disability | |||
Intellectual Disability | |||
Language Impairment | |||
Moderate Intellectual Disability | |||
Multiple Disabilities | |||
Orthopedic Impairment | |||
Other Health Impairment | |||
Severe Intellectual Disability | |||
Specific Learning Disability | |||
Speech Impairment | |||
Traumatic Brain Injury | |||
Total |
Viewing Report Data as Graphs
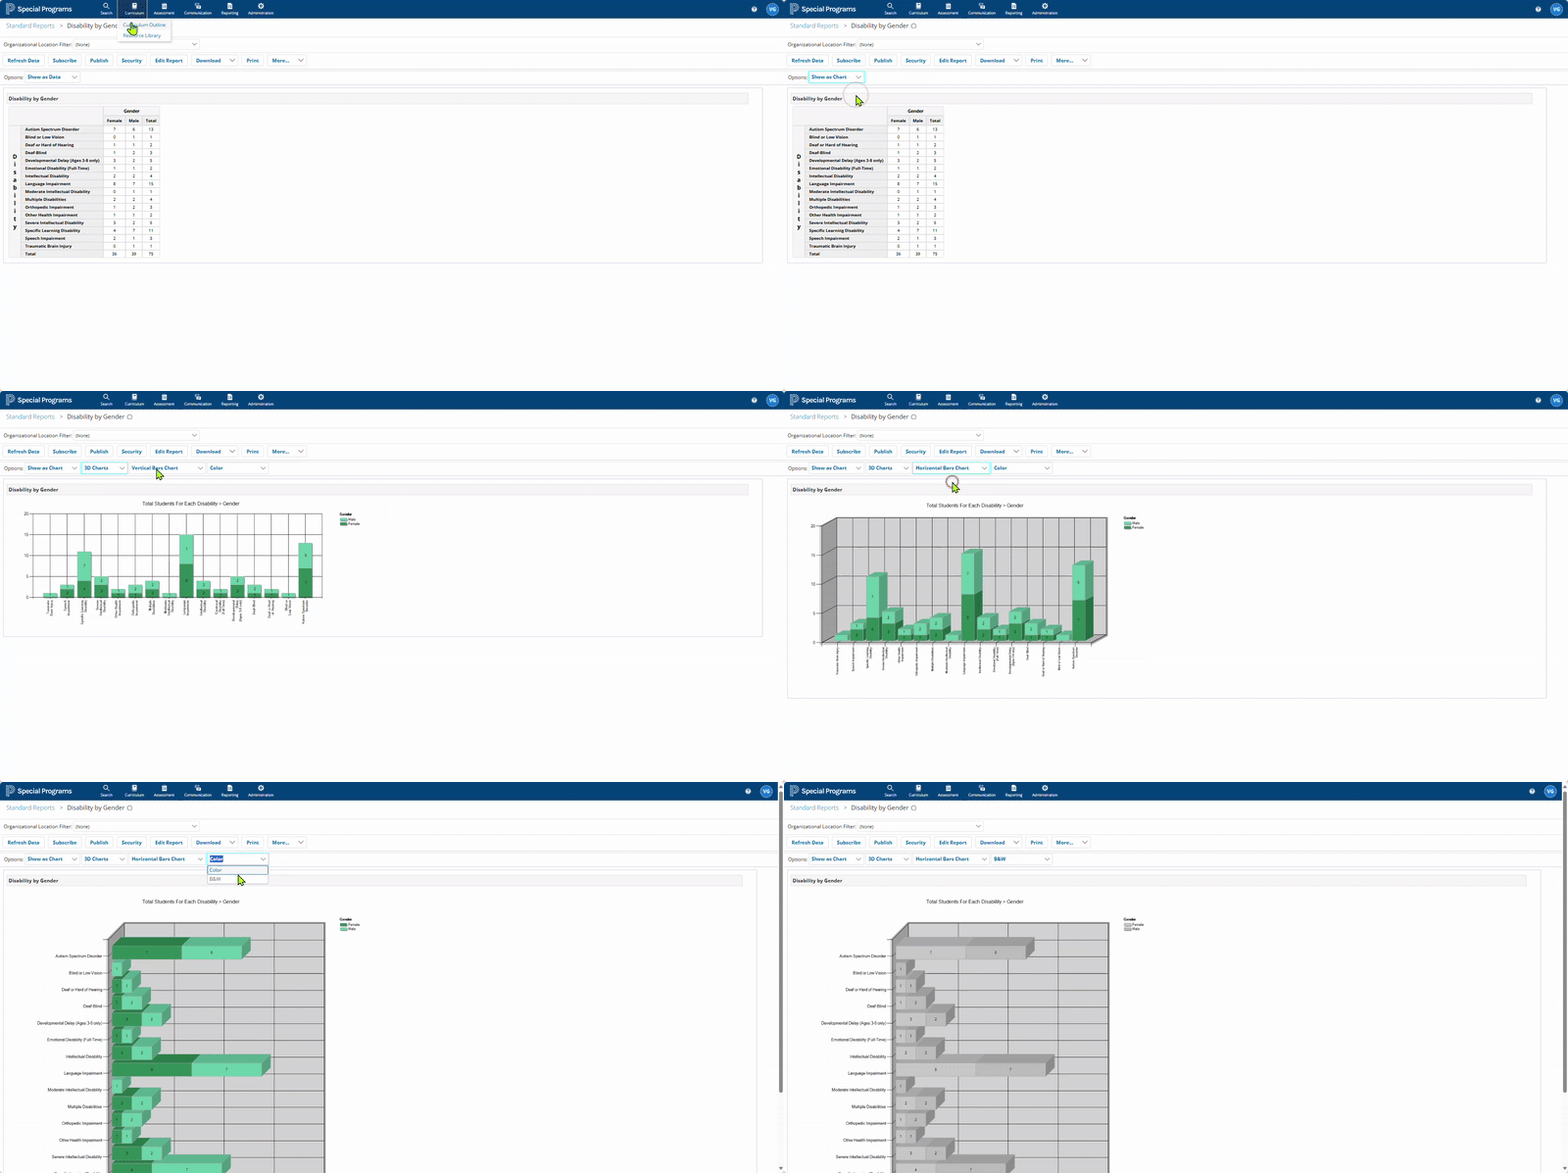
Go to Options, for the first drop-down, select ‘Show as Chart’.
This will reveal three further sub-menu options.
The first drop-down gives two options: 2D Charts and 3D Charts.
The second drop-down gives two options: Vertical Bar Charts and Horizontal Bar Charts.
The third drop-down offers two options: Color and B&W.
All three sub-menus are agnostic of each other.
Thus, based on various combinations, the system renders the statistical data from the tabular report.
Choices for the ‘Colors’ in the graphs are hardcoded, therefore restricted to the preconfigured gradients.
The following animation shows the sequence of steps to generate the Disability by Gender in a graphical format.

Viewing the Disability by Gender Report in Graphical format
