
Create a Multi-Dimensional Report
-
Select Reports > Standard Reports.
-
Click New Multi-dimensional Report.
-
In the Report Name field, enter a unique name for the report.
-
If you are creating a new public report, use the Optional Category field as follows:
-
To add the report to an existing category, select the category.
-
To create a new category, select (new category), and then enter the category name.
-
To display the report in a default category, select None.
-
-
In the Type of Information field, select the information to include in the report. By default, Students is selected. You can change this to focus on staff, locations, etc.
-
In the Selection Criteria field, define the formula for selecting the records to appear in the report.2
-
To select fields based on where they display in PowerSchool Special Programs, click the Quick Formula link. When your formula is completed, click Update and Accept Formula.
-
To build a complex formula that contains nested logic, use the Formula Editor.
-
-
If additional fields display below the Selection Criteria text box, select the options as needed.
-
Select the categories for the report by specifying up to three dimensions. Click Select Field to select the field to use from a form that shows where the field displays in the software.
-
Select the field to use for the rows in 1st Dimension - Rows.
-
To display a dimension in a column, select the field to use in 2nd Dimension - Columns.
-
To display an additional level of dimension in the columns, select the field to use in 3rd Dimension - Columns.
-
-
To include a total for a dimension, select Include Totals for that dimension.
-
Click Accept. The report displays counts based on the selected dimensions.
-
Review the report and make additional changes as needed.
-
Select the count to view details for a count.
-
Click the column or row header to view a chart for a dimension.
-
Rearrange the dimensions as needed by dragging dimensions in the Dimensions panel.
-
-
Click Finish Editing Report.
Add New Measures
Add measures if you want to analyze aggregate (statistical) measures based on numeric data.
-
Click + Add New Measure.
-
On the Add New Measure menu, click Select Field.
-
In the Function field, select the aggregate (statistical) function to apply to the numeric data.
-
In the Measure Title field, enter a descriptive title. You can also enter an abbreviated label in the Number Label field to display next to numbers in the numeric grid.
-
Click Accept.
-
To view the underlying numeric field data used to produce the aggregate values, select the group.
-
If needed, add additional measures to the report by repeating steps 1 - 5.
Customize Columns
By default, any fields referenced in the multi-dimensional report definition will appear when you select a report count or statistic. However, you can override the default and control exactly what columns appear in the detail view.
-
While editing the report, click More... and then select Set Drilldown Columns.
-
Select Use Columns Selected Below.
-
For each column to include, click the column name in the Available Columns list on the right, and then click the right arrow button to move the selected column from the Available Columns list on the left to the Drilldown Columns list on the right.
-
If you want to override the default column header name that displays in the report, select the column in the Drilldown Columns list on the right, and then click the Edit (pencil) icon. In the Edit Column Caption screen, enter the name you want to appear as the detail view column header, and then click Accept. The column header label is changed only in the context of this multi-dimensional report.
-
Click Accept.
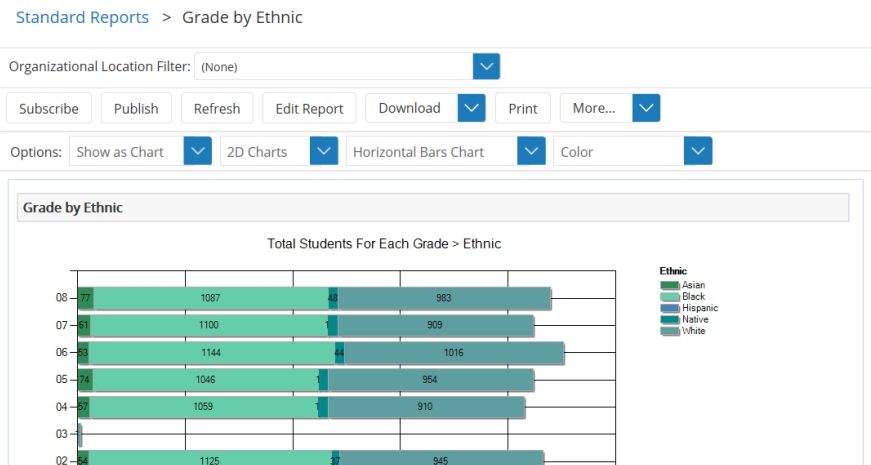
Display Report as a Chart
By default, multi-dimensional reports display in a tabular data form. If the report has one or two dimensions, you can display the report as a chart. A report with three dimensions cannot be displayed as a chart, but it still supports detailed view charting.
-
While editing the report, select the Show as Chart option from the Options menu.
-
Use the additional chart fields which display in Options to try out the 2D, 3D, horizontal, vertical, color, and black and white variations of the chart.
-
To set the chart view you have displayed as the default for all users accessing the report, click Set as Default.